SOURCE PULSE
The Source Pulse page provides a comprehensive, real-time overview of procurement and sourcing operations. It is divided into two role-specific views — Manager View and Engineering View — each tailored to deliver actionable insights relevant to the respective audience.
Navigation
- In the left navigation panel, under Dashboard, click Source Pulse
- Path:
Dashboard → Source Pulse.
- Path:
- The main content area loads the Source Pulse page.
Analysis
The Analysis section is divided into two role-specific views — Manager View and Engineering View — each tailored to deliver actionable insights relevant to the respective audience.
MANAGER VIEW
The Manager View is designed to give senior stakeholders and procurement managers a high-level snapshot of overall project health, financial performance, supplier efficiency, and data freshness. It consolidates critical metrics into a single screen to support fast, informed decision-making.
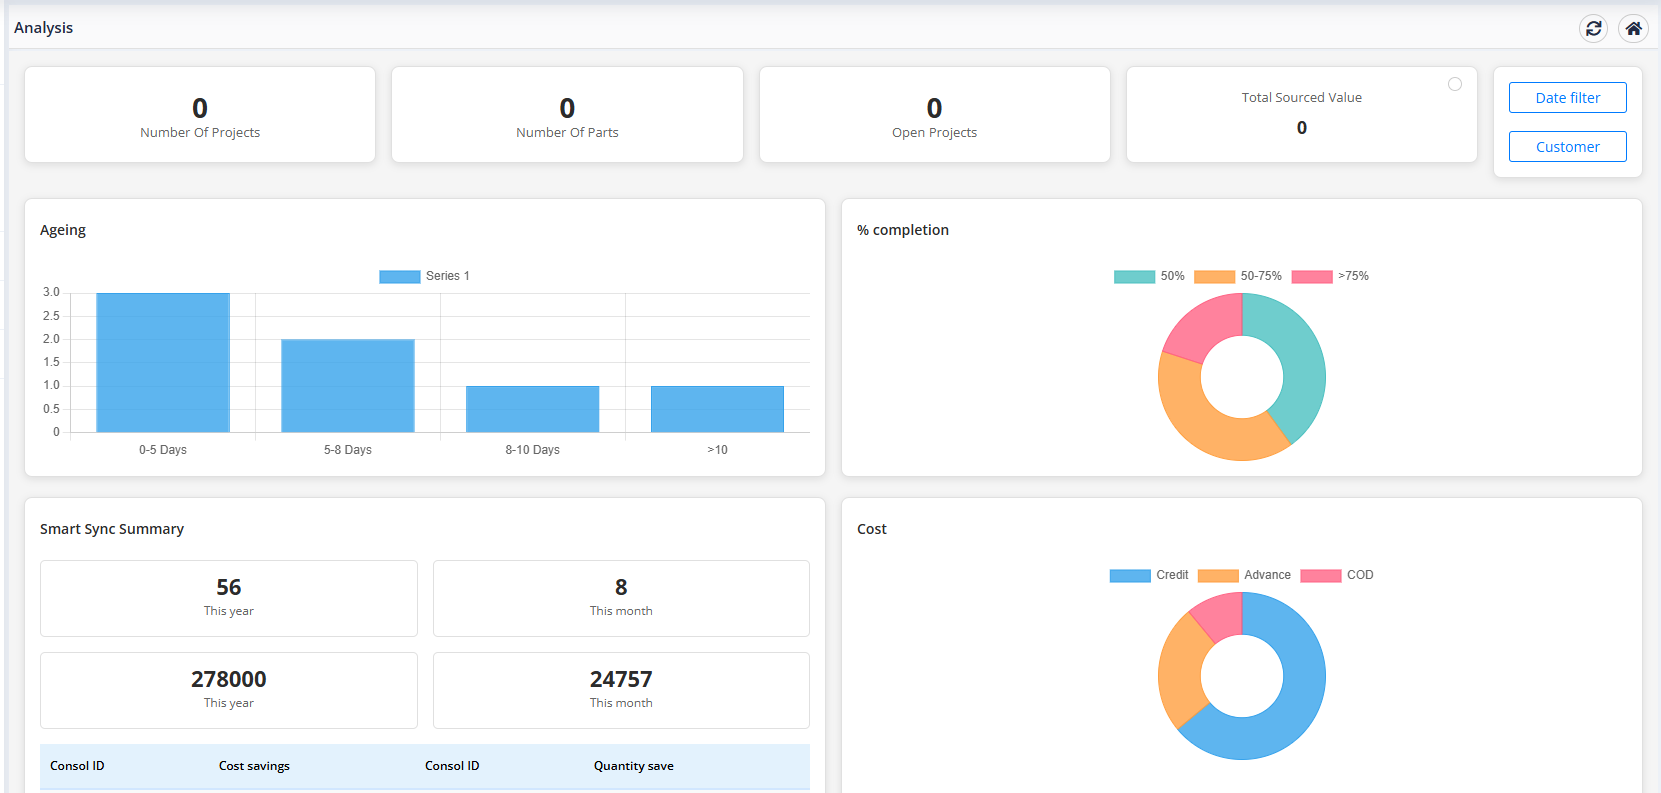
Key Metrics (Top Summary Cards)
At the top of the dashboard, managers can view high-level summaries of ongoing operations:
- Number Of Projects: The total count of active procurement projects (e.g., 57).
- Number Of Parts: The total number of unique parts across all projects (e.g., 2863).
- Open Projects: The number of projects currently in progress and not yet closed (e.g., 56).
- Total Sourced Value: The cumulative value of all sourced parts in INR (e.g., 6,63,27,09,218).
- Filters: Managers can use the Date filter and Customer selection tools at the top right to narrow down the metrics.
Dashboard Components
1. Ageing Chart
The Ageing bar chart classifies open projects based on the duration they have been active. It groups them into the following time buckets:
- 0-5 Days: Newly created projects.
- 6-8 Days: Mid-stage projects requiring progression.
- 9-10 Days: Late-stage projects approaching turnaround thresholds.
- >10 Days: Overdue projects requiring immediate management attention.
2. % Completion Chart
The % completion donut chart shows the status distribution of the projects:
- <50%: Early-stage projects.
- 50-75%: Moderately progressed projects.
- >75%: Projects nearing final completion.
- Interactive Feature: Click on any segment of the donut chart to filter the project list directly.
3. Smart Sync Summary
A comprehensive widget tracking automatic synchronization and order consolidation data:
- Yearly/Monthly Stats: Quick summary boxes displaying synchronization counts and total value synced (e.g., 6 This year, 4 This month counts, and corresponding values 25,065,286.24 and 25,042,826.35 in INR).
-
Consolidation Details: A nested table showing individual consolidation data:
- Consol ID: The unique identifier for the consolidated batch.
- Cost savings: Sourcing savings achieved.
- MPN: Manufacturer Part Number.
- Quantity: Sourced quantity.
- Created Date: Sync timestamp.
4. Payment Terms Distribution
The Payment Terms Distribution bar chart shows the proportion of sourcing transacted under different payment arrangements (such as Credit, Advance, or unmapped payment terms like NULL_PAYMENT_TERM).
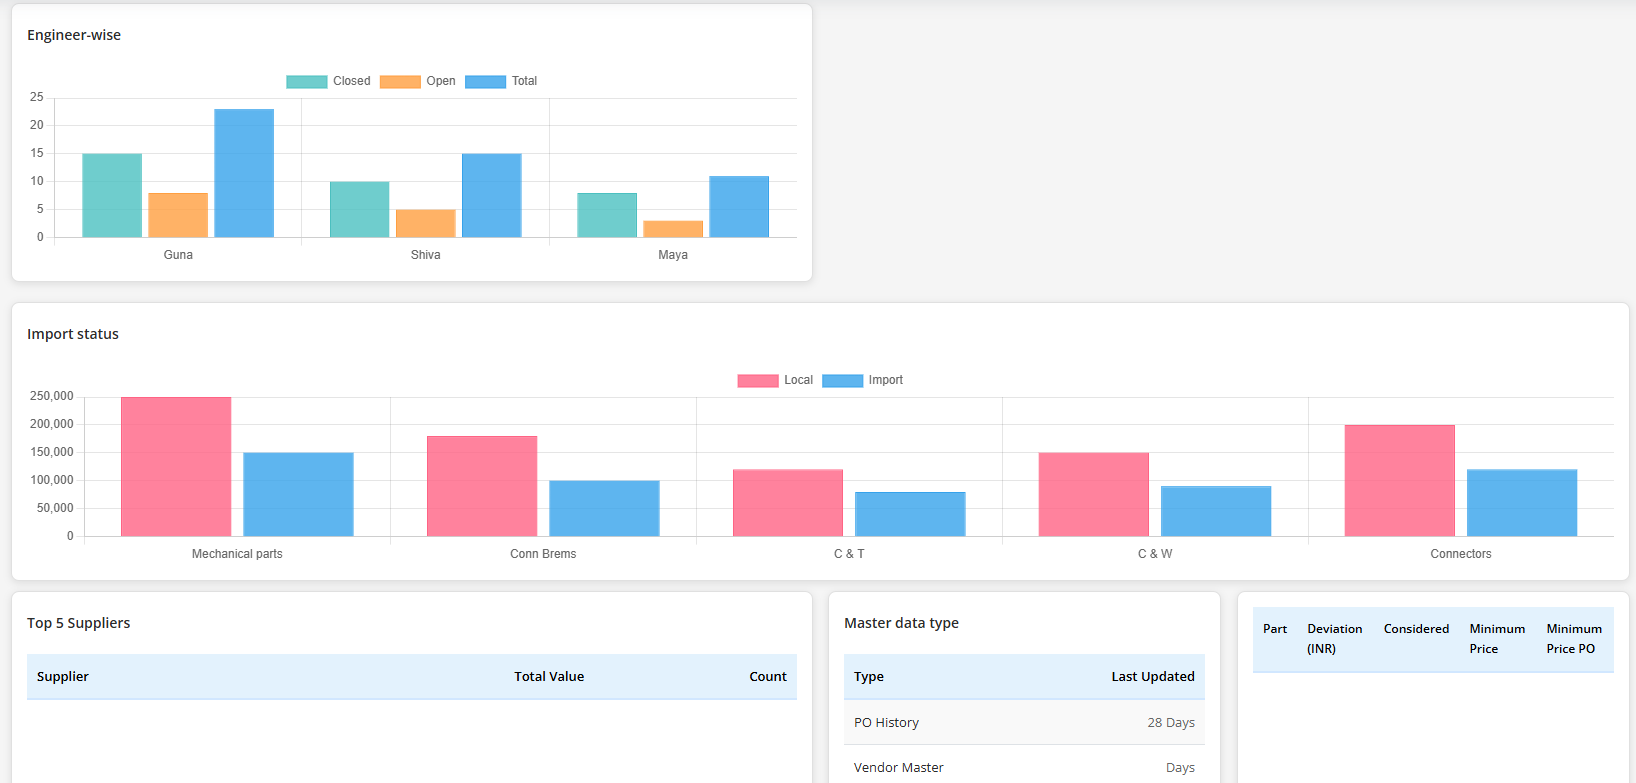
5. Engineer-wise Workload Chart
The Engineer-wise bar chart details the project workload distribution across the sourcing team:
- Closed: Completed projects per engineer.
- Total: Total projects assigned to each engineer.
- Open: Projects currently active for each engineer.
6. Master Data Type Freshness
The Master data type table monitors how recently key reference rates and data matrices were updated:
- PO History: Purchase order history (e.g., 145 Days since update).
- Vendor Master: Supplier records database freshness.
- Currency: Currency conversions and exchange rates (e.g., 39 Days since update).
- Freight: Shipping and logistics freight matrices.
- Duty: Customs and HSN duty matrices.
7. Top 5 Suppliers
Lists the top 5 vendors ranked by their cumulative sourcing volume:
- Supplier: Vendor name (with links for deeper analysis, e.g., Mouser, Powell Electronics).
- Total Value: Total purchasing value in INR.
- Count: Number of items or quotes processed.
8. Part Deviation (INR)
Identifies parts with the highest cost deviation between considered quotes and the minimum price recorded:
- Part: Part link/number.
- Deviation (INR): Absolute cost variance.
- Considered: Sourcing price considered.
- Minimum Price: Lowest available market price.
- Minimum Price PO: Reference PO number for the minimum price.
- Project Id: Associated project identifier.
ENGINEER VIEW
The Engineering View is tailored for sourcing engineers and technical procurement teams. It provides a focused, engineer-level perspective on project workload, part lead times, sourcing channel mix, cost structure, and supplier performance — enabling engineers to manage day-to-day sourcing activities with precision.
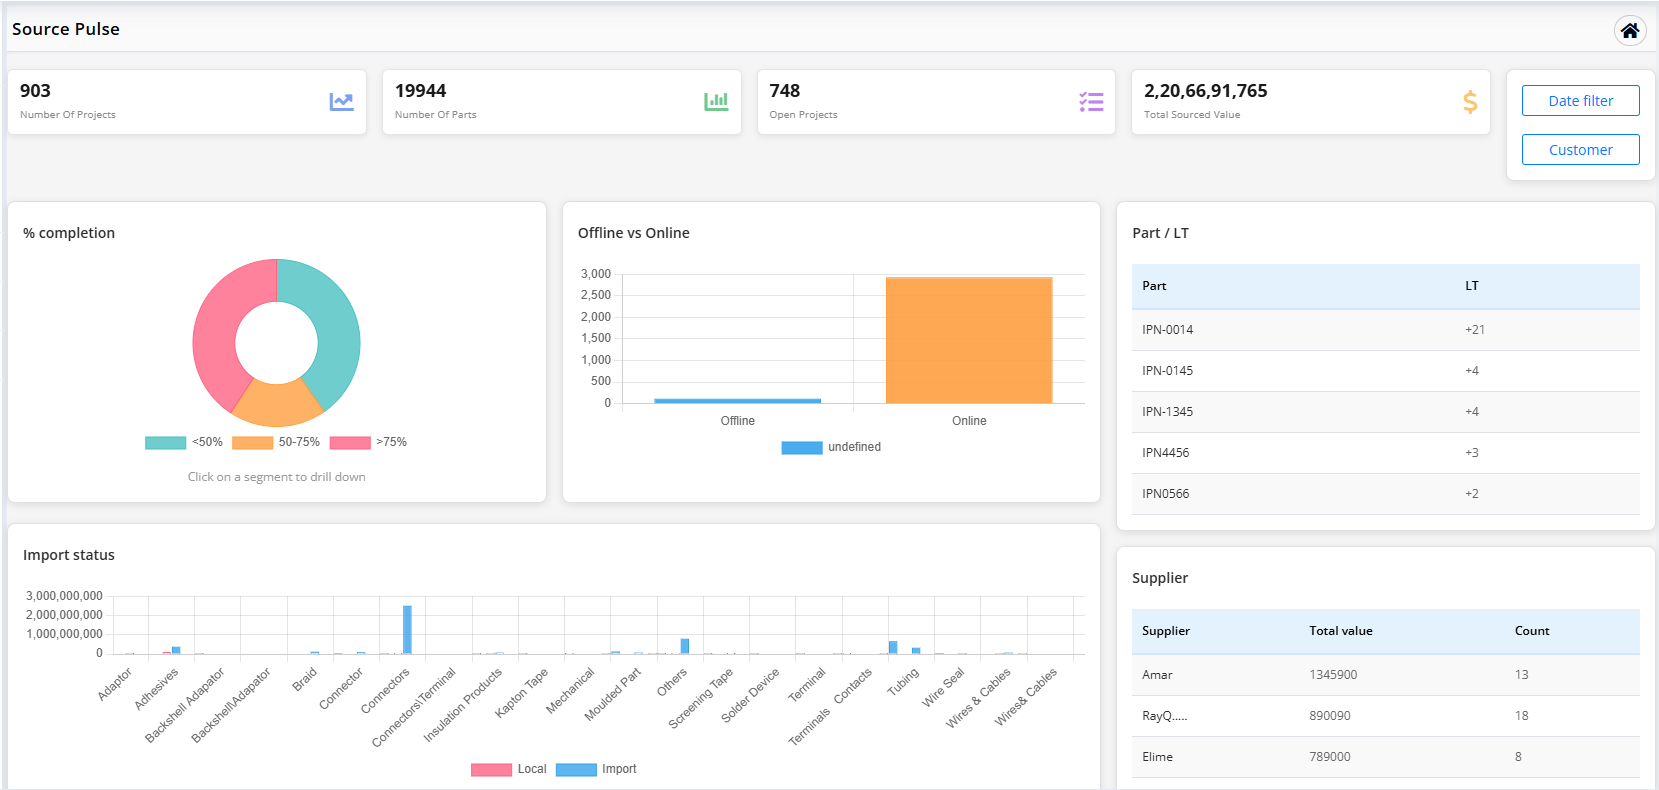
Key Metrics (Top Summary Cards)
At the top of the dashboard, engineers can view high-level summaries of ongoing operations:
- Number Of Projects: The total count of active procurement projects (e.g., 57).
- Number Of Parts: The total number of unique parts across all projects (e.g., 2863).
- Open Projects: The number of projects currently in progress and not yet closed (e.g., 56).
- Total Sourced Value: The cumulative value of all sourced parts in INR (e.g., 6,63,27,09,218).
- Filters: Engineers can use the Date filter and Customer selection tools at the top right to narrow down the metrics.
Dashboard Components
1. % Completion Chart
The % completion donut chart shows the status distribution of the projects:
- <50%: Early-stage projects (e.g., 17%).
- 50-75%: Moderately progressed projects (e.g., 31%).
- >75%: Projects nearing final completion (e.g., 60%).
- Interactive Feature: Click on any segment of the donut chart to drill down into the list of projects.
2. Offline Vs Online Sourcing Chart
The Offline Vs Online donut chart compares the proportion of parts sourced offline versus online:
- Offline: Parts sourced via manual procurement channels (e.g., 19 parts).
- Online: Parts sourced through online e-procurement portals (e.g., 1868 parts).
3. Part / LT Table
This table lists critical parts along with their lead time (LT) status:
- Part: The Internal Part Number (IPN) of the component.
- LT: The lead time deviation, indicating delivery schedule variances.
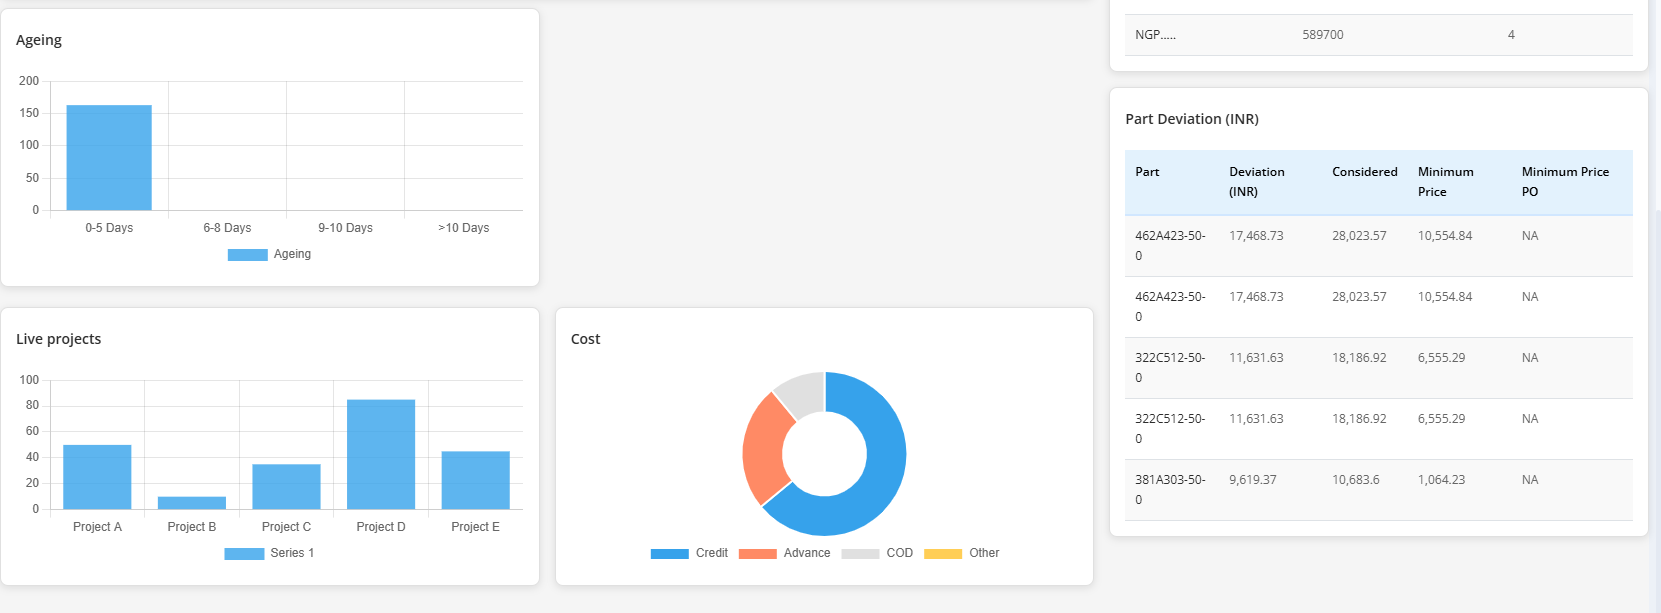
4. Ageing Chart
The Ageing bar chart classifies open projects based on the duration they have been active. It groups them into the following time buckets:
- 0-5 Days: Newly created projects (e.g., 56 projects).
- 6-8 Days: Mid-stage projects requiring progression.
- 9-10 Days: Late-stage projects approaching turnaround thresholds.
- >10 Days: Overdue projects requiring immediate attention.
5. Part Deviation (INR)
Identifies parts with the highest cost deviation between considered quotes and the minimum price recorded:
- Part: Part link/number.
- Deviation (INR): Absolute cost variance.
- Considered: Sourcing price considered.
- Minimum Price: Lowest available market price.
- Minimum Price PO: Reference PO number for the minimum price.
- Project Id: Associated project identifier.
6. Supplier (Key Vendors) Table
Ranks vendors by total sourcing transaction volume:
- Key vendors.: Sourcing supplier name (e.g., Mouser, Powell Electronics).
- value: Cumulative purchasing value in INR.
- Count: Number of items or quotes processed.
7. Payment Terms Distribution
The Payment Terms Distribution horizontal bar chart displays the proportion of sourcing transacted under different payment terms (e.g., displaying Other with a share of 100% and total amount details).
Use the Date Filter and Customer filter buttons at the top-right of the dashboard to filter all metrics and charts for a specific timeframe or customer account.