PROJECT DETAILS
The Project Details page provides a comprehensive view of a specific project, allowing engineers to manage parts, view sourcing status, and analyze costs.
Header Information
- Project Name: The name of the project (e.g., Project 1).
- Version: The current version of the project (e.g., Version 1).
Tabs
The page is divided into three main tabs:
- Source Board: Provides visual analytics and charts to assess project data distribution and trends.
- Supply Sense: The active tab showing detailed part information and sourcing status.
- Compare: Allows side-by-side comparison of different costing scenarios or project versions.
Source Board
The Source Board tab provides an analytical view of the project data through visual charts and graphs. This helps engineers quickly assess the distribution of parts across different categories or metrics.
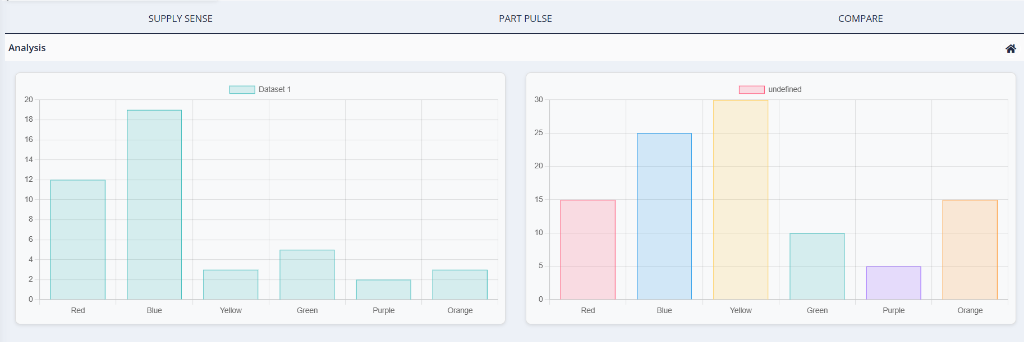
Analysis
The Analysis section features interactive charts and tables that provide a comprehensive overview of the project. Together, these tools give engineers a clear picture of project health, cost distribution, sourcing strategy, and potential risks:
-
Project Overview: A summary of high-level project metrics, including overall completion percentage, total number of parts, closed parts, and the total project cost.
-
Cost Analysis: A pie chart displaying the cost distribution broken down by currency, giving a clear view of multi-currency spend across the project.
-
Payment Terms: A detailed breakdown of the payment terms associated with the project, showing the distribution of terms and their respective values and percentages.
-
Sourcing Insights: Charts comparing offline versus online sourcing volumes, along with a summary of key vendors involved in the project, including their contribution by value and count.
-
Commodity vs Region vs Value: An interactive bar chart visualizing the distribution of commodity types (such as Contacts, Connection Elements, Connectors, and Insulators) across different geographic regions (such as US Region, Other Asia, Europe Region, and India). This enables quick comparison of commodity volumes and values across geographies.
-
Project History: A log of key project events and assignments, providing a timeline of important actions taken on the project.
-
Deviation Analysis: A table highlighting parts where the considered price deviates from the minimum available price, helping engineers identify cost-saving opportunities.
-
Quantity Differences: A table surfacing discrepancies between the required quantities and the quantities available or ordered, flagging parts that may need attention.
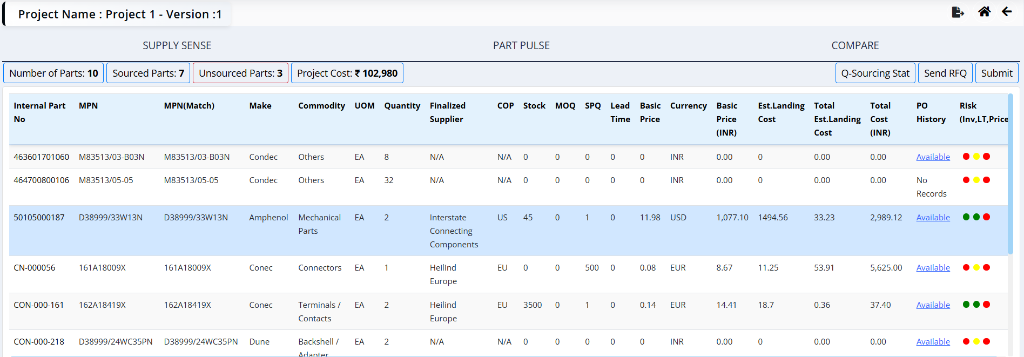
Supply Sense
The Supply Sense tab acts as the central hub for managing the project's bill of materials (BOM). It provides a detailed breakdown of all parts, their current sourcing status, and associated costs. This view enables engineers to track which parts are sourced, identify pending items, and make informed decisions based on supplier data and risk assessments.
Summary Metrics
At the top of the Supply Sense tab, you can see key metrics:
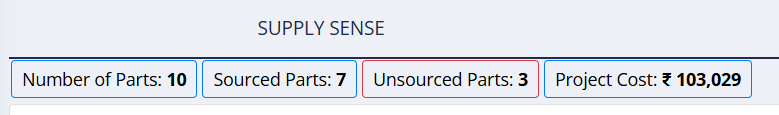
- Number of Parts: Total parts in the project (e.g., 10).
- Sourced Parts: Number of parts that have been sourced (e.g., 7).
- Unsourced Parts: Number of parts pending sourcing (e.g., 3).
- Project Cost: Total cost of the project (e.g., ₹ 102,980).
Clicking on any of the summary metric cards (e.g., Sourced Parts, Unsourced Parts) will filter the data table below to display only the relevant parts matching that category.
Data Table
The table lists all parts associated with the project. Key columns include:
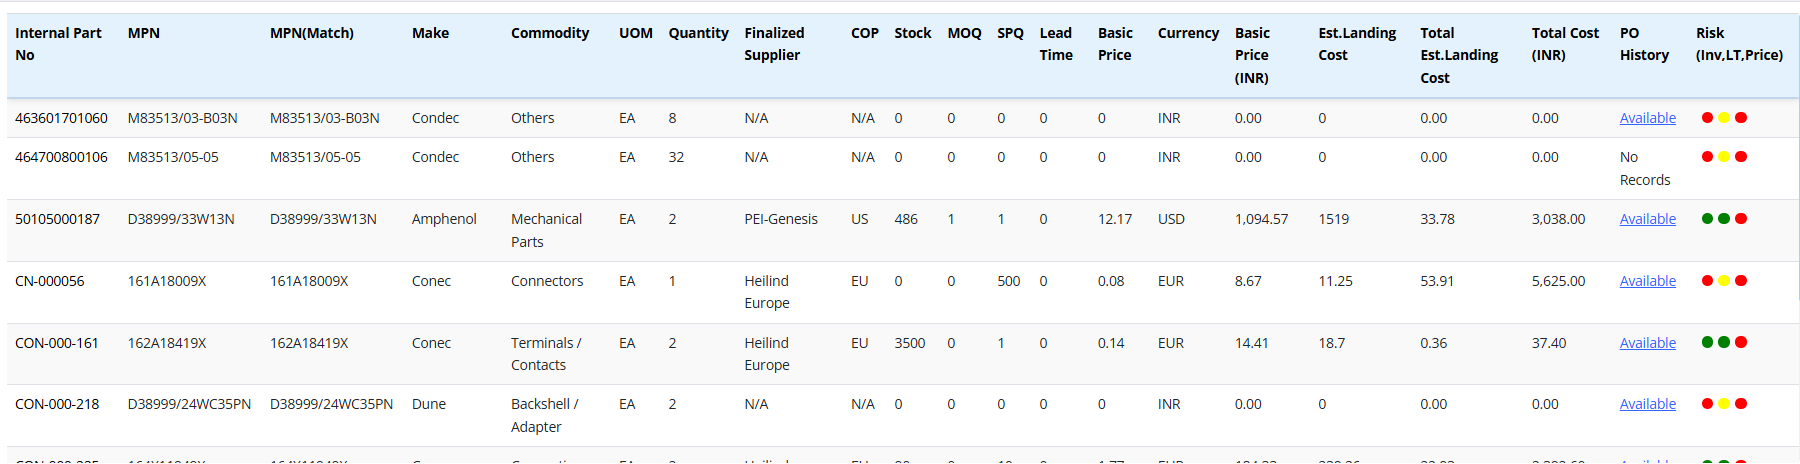
- Internal Part No: The unique alphanumeric identifier assigned to the part within the internal system for tracking and inventory purposes.
- MPN: Manufacturer Part Number - The specific part number assigned by the manufacturer.
- MPN(Match): Indicates if the system found a matching MPN in the database or external sources.
- Make: The brand or manufacturer name of the component (e.g., Condec, Amphenol).
- Commodity: The classification category of the part (e.g., Electronics, Mechanical, Fasteners).
- UOM: Unit of Measure - The standard unit used for quantifying the part (e.g., Each, Meters, Kilograms).
- Quantity: The total number of units required for the specific project.
- Finalized Supplier: The vendor or supplier that has been selected and approved for sourcing this part.
- To change the supplier click on the Internal Part No it will take it to a different screen with all this information.
- COP: Country of Production - The country where the part is manufactured.
- Stock: The current quantity available in inventory or with the supplier.
- MOQ: Minimum Order Quantity - The smallest number of units that must be purchased in a single order.
- SPQ: Standard Pack Quantity - The number of units contained in the manufacturer's standard packaging.
- Lead Time: The estimated time (in days or weeks) from order placement to delivery.
- Basic Price: The unit cost of the part before taxes, duties, or shipping.
- Currency: The currency in which the basic price is quoted (e.g., INR, USD, EUR).
- Est. Landing Cost: The estimated total cost per unit delivered to the final destination, including shipping, customs, and duties.
- Total Est. Landing Cost: The calculated total landing cost for the entire required quantity (Est. Landing Cost * Quantity).
- Total Cost (INR): The final total cost converted to Indian Rupees for financial reporting.
-
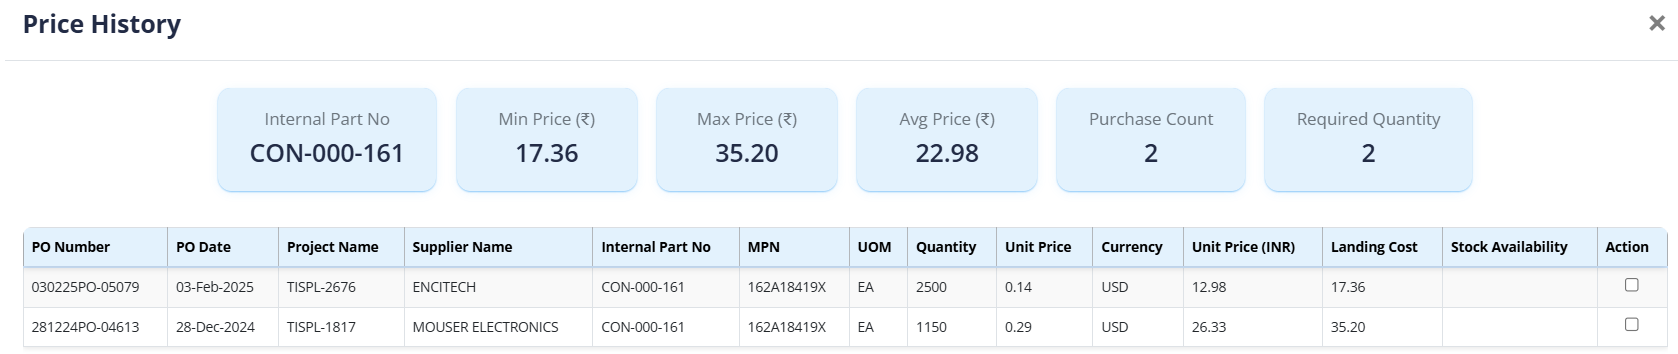
PO History: A link or indicator showing past purchase orders for this part to reference historical pricing and suppliers.
- This feature is ideal for regularly purchased products where the engineer is familiar with the supplier and pricing. By clicking on PO History, engineers can view past purchase orders and select a previous purchase cost to expedite project submission.
-
Risk: A visual risk assessment (Red/Yellow/Green indicators) evaluating factors such as Inventory availability, Lead Time stability, and Price volatility.
Actions
- Q-Sourcing Stat: View Q-sourcing stat.
- Send RFQ: Initiate the Request for Quotation process.
- Submit: Submit the project details.
Compare
The Compare tab allows engineers to compare different costing scenarios or versions of the project side-by-side. This is useful for analyzing the impact of different suppliers, quantities, or sourcing strategies.
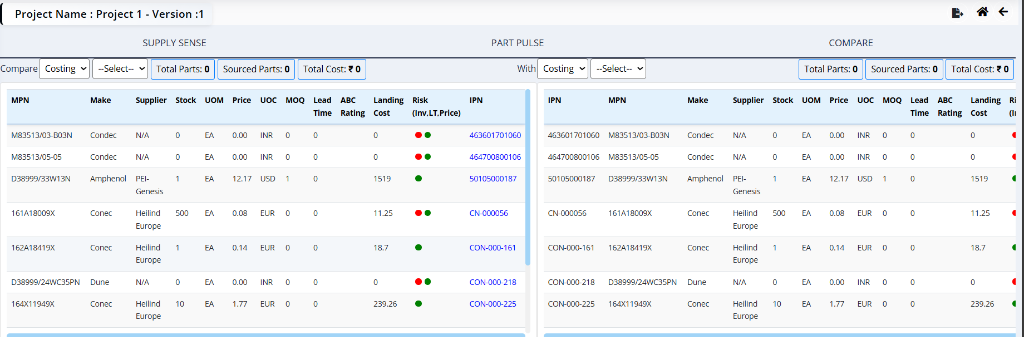
Comparison Interface
The interface is divided into two panels:
- Left Panel (Compare): Select the primary costing scenario or version.
- Right Panel (With): Select the secondary costing scenario or version to compare against.
Each panel displays summary metrics for the selected scenario:
- Total Parts: Total number of parts in the selection.
- Sourced Parts: Number of parts that have been sourced.
- Total Cost: The total calculated cost for the selection.
Comparison Table
Below the headers, a detailed table lists the parts for each scenario, allowing for a direct line-by-line comparison. Key columns include:
- MPN: Manufacturer Part Number - The specific part number assigned by the manufacturer.
- Make: The brand or manufacturer name of the component (e.g., Condec, Amphenol).
- Supplier: The vendor or supplier associated with this specific costing scenario.
- Stock: The quantity currently available in inventory or with the supplier.
- UOM: Unit of Measure - The standard unit used for quantifying the part (e.g., Each, Meters).
- Price: The unit cost of the part in the specified currency.
- UOC: Unit of Currency - The currency code for the price (e.g., INR, USD).
- MOQ: Minimum Order Quantity - The smallest number of units that must be purchased.
- Lead Time: The estimated time for delivery.
- ABC Rating: A classification used to prioritize inventory management (e.g., A-items are high value, C-items are low value).
- Landing Cost: The total cost per unit including shipping, customs, and duties.
- Risk: A visual indicator (Red/Green) representing the risk associated with the part's availability or pricing.
- IPN: Internal Part Number - The unique identifier used within the internal system.